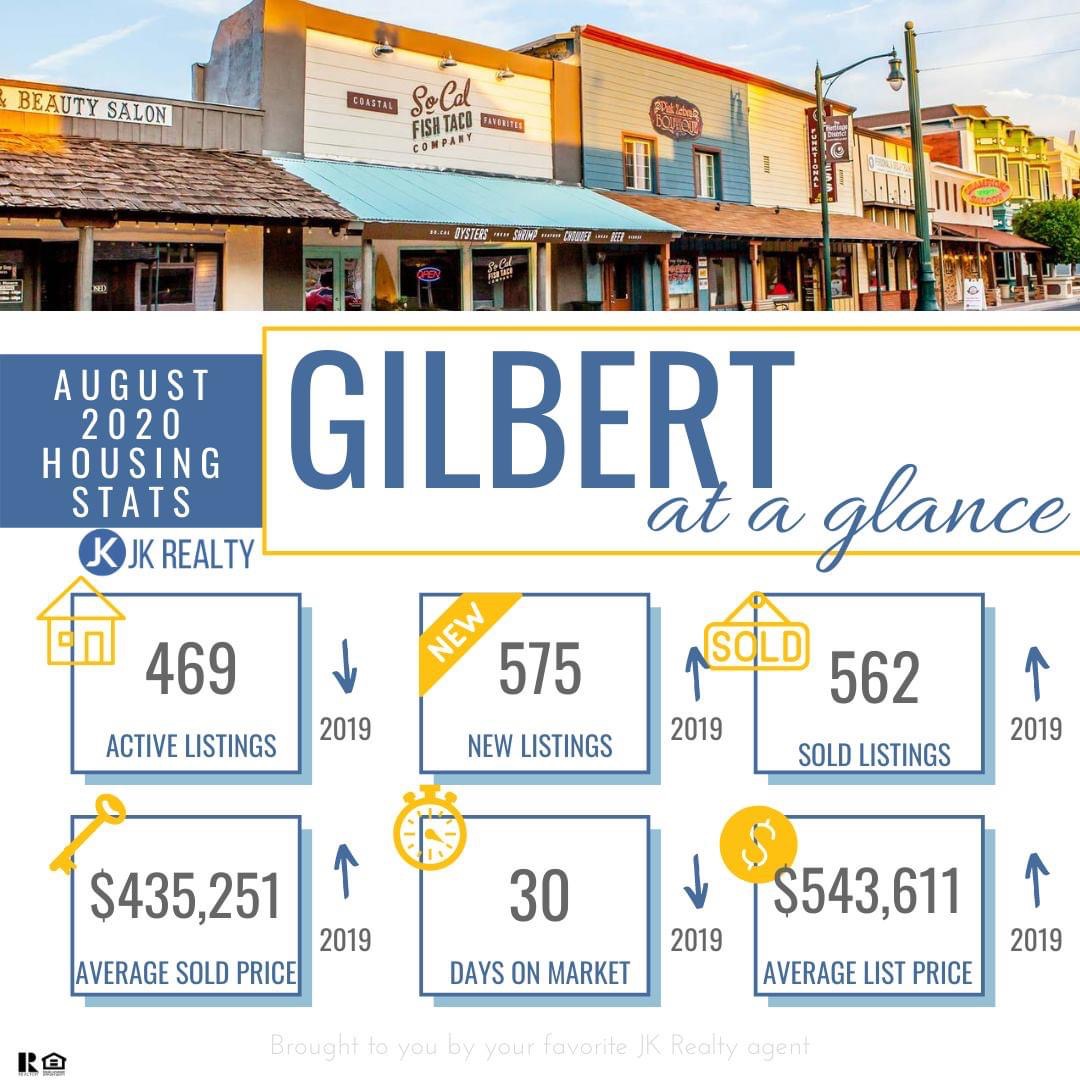
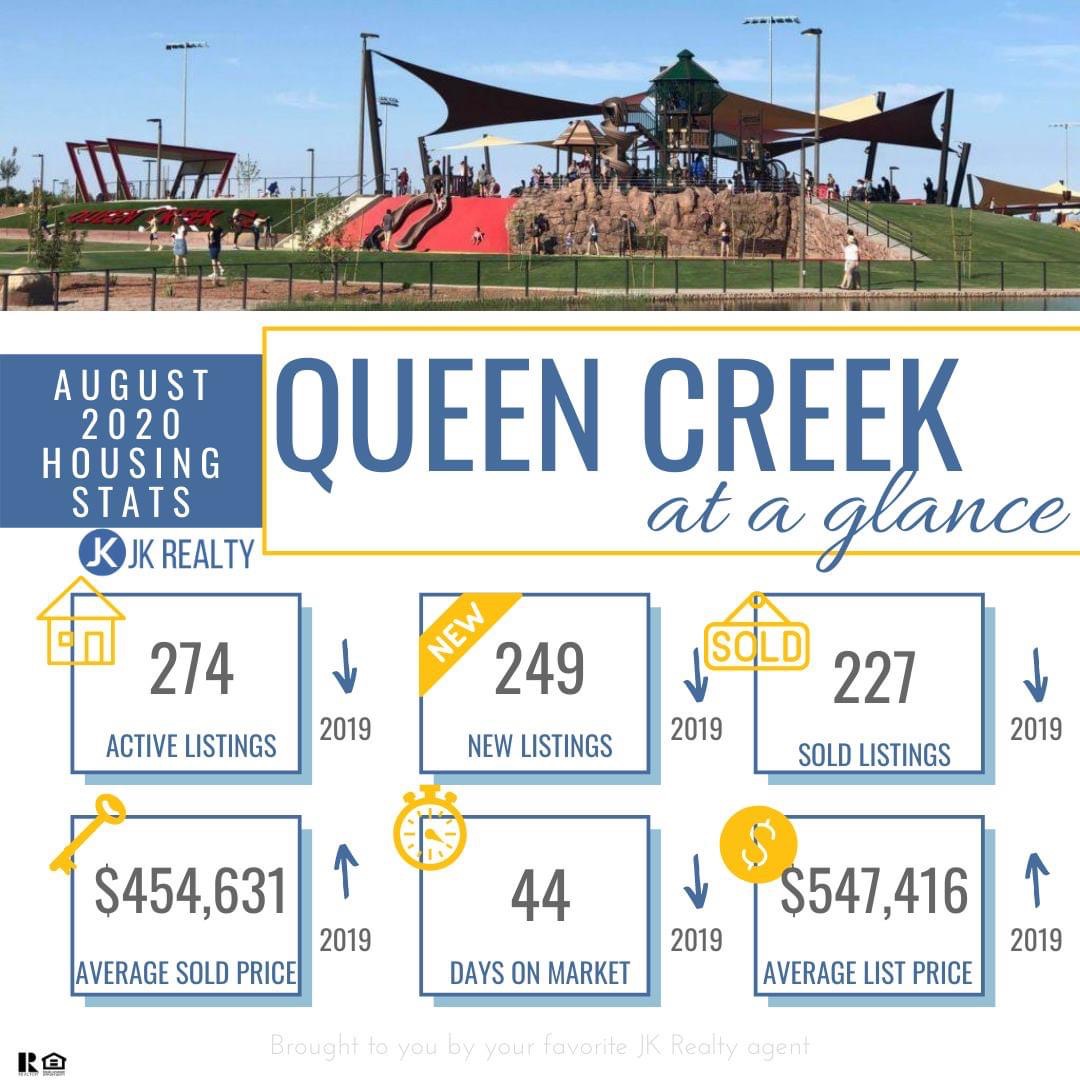
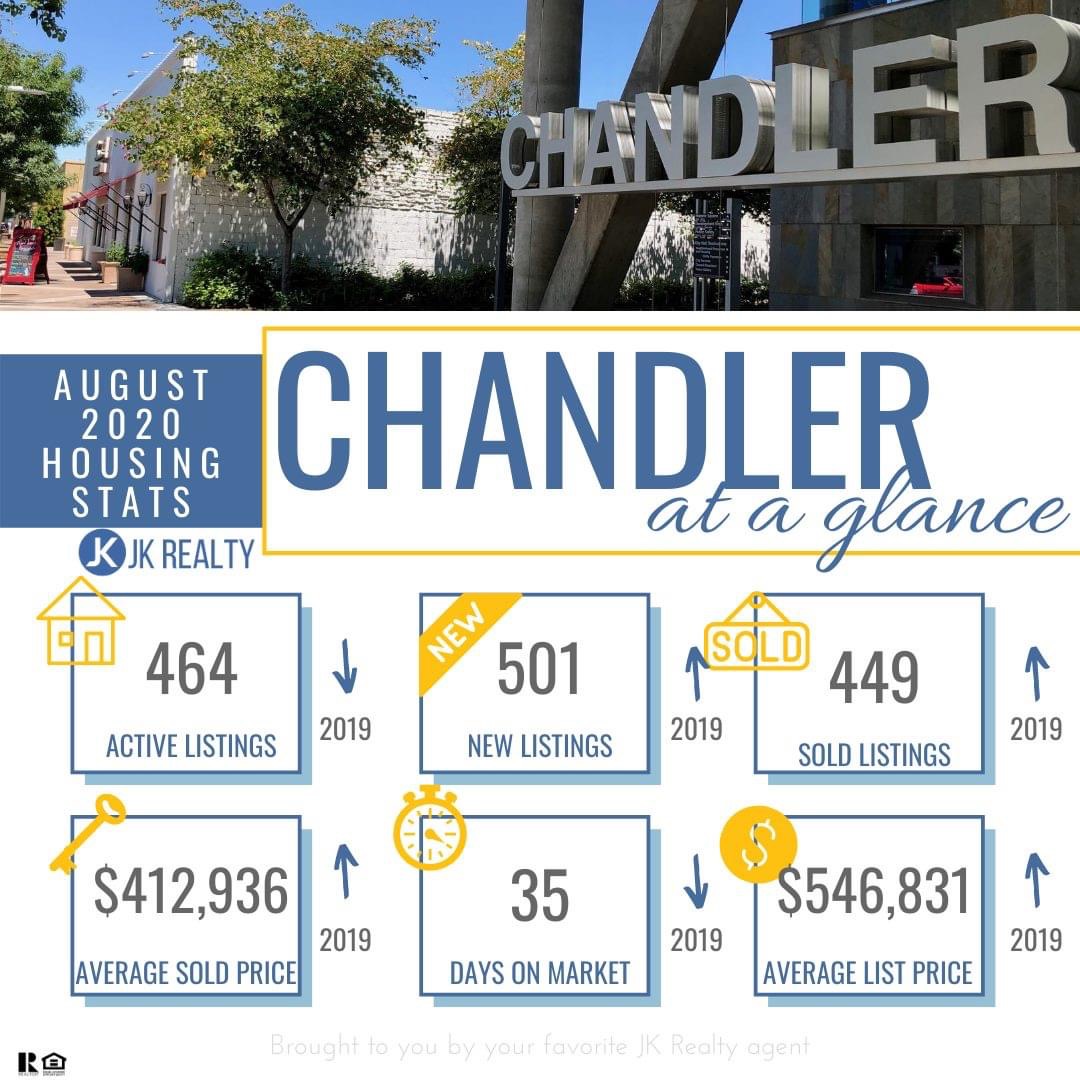
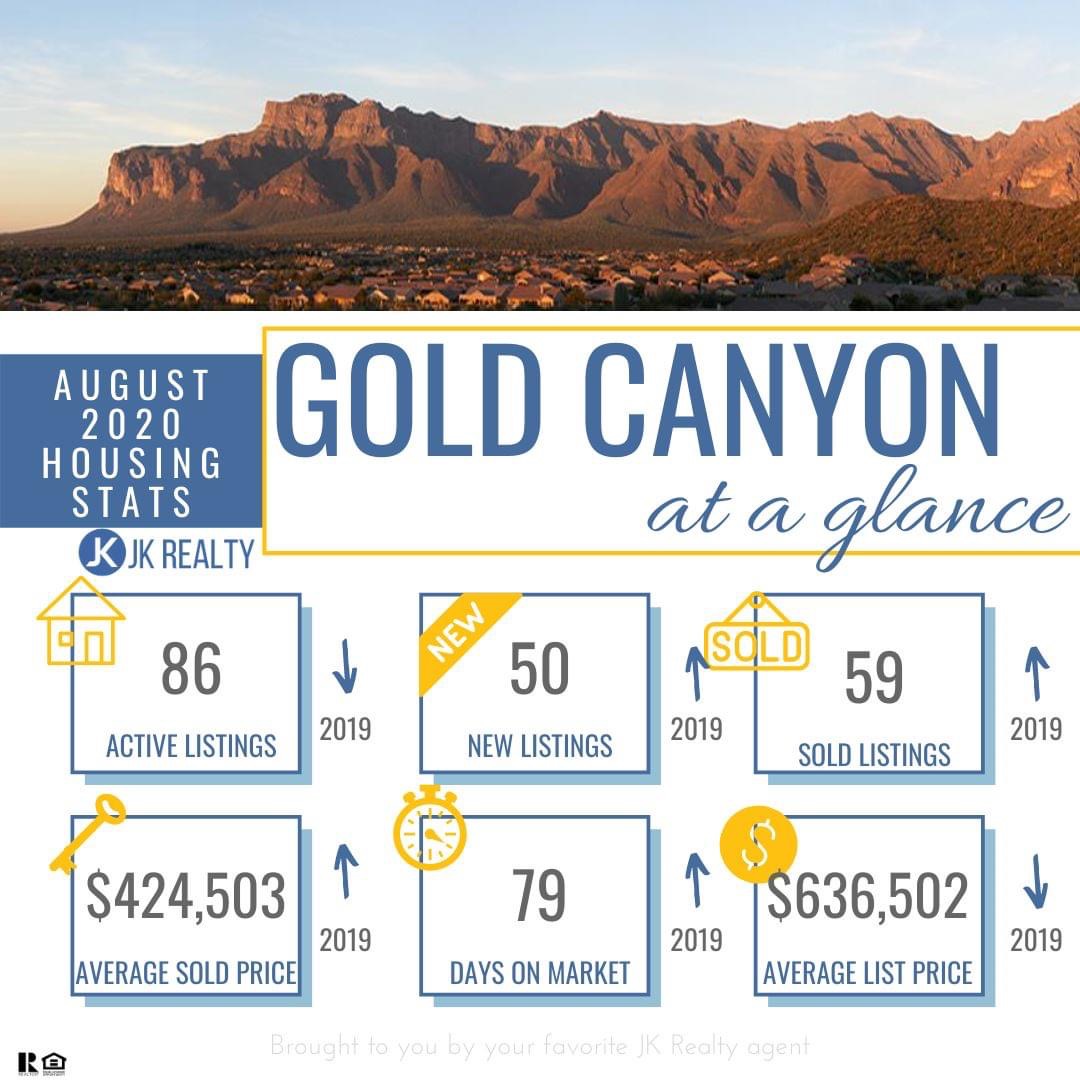
Yep, it’s that time again. Another month has passed and we have some new Market numbers to look at. There is a small change to the look of my updates. You will now notice a small arrow next to the stats showing if there was an increase or decrease over the same month in 2019. **An important note regarding this year-over-year metric, it’s not overly important what happens compared to one month. Overall we want to consider how we are looking each month over the year, so don’t panic if you see one metric go backward for only one month.
A few highlights for this month’s stats:
Leave a Reply