How are interest rates impacting the market? Probably the #1 question I am getting right now.
We did see a bit of a shift for Maricopa County as a whole in the month of April. In fact, for the first time in what feels like forever, we had an overall decrease in average sale price, dropping by $45,000 with a 67% increase in inventory.
That being said, DON’T PANIC! It is important to note that this was for one month and for the entire Maricopa County which includes a lot of different areas, price points, and types of homes. While a 67% increase in inventory sounds like a lot. In reality, all that did was bump us up to a 1.67 month supply of homes. We would need to see it jump to a 6-month supply to get us back to a balanced market.
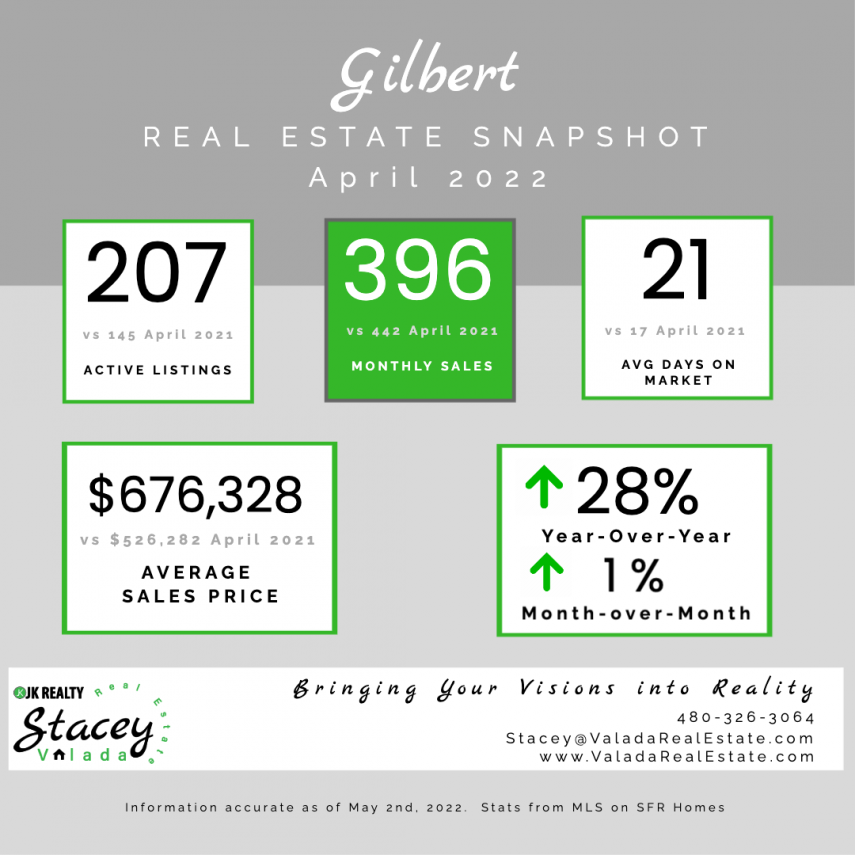
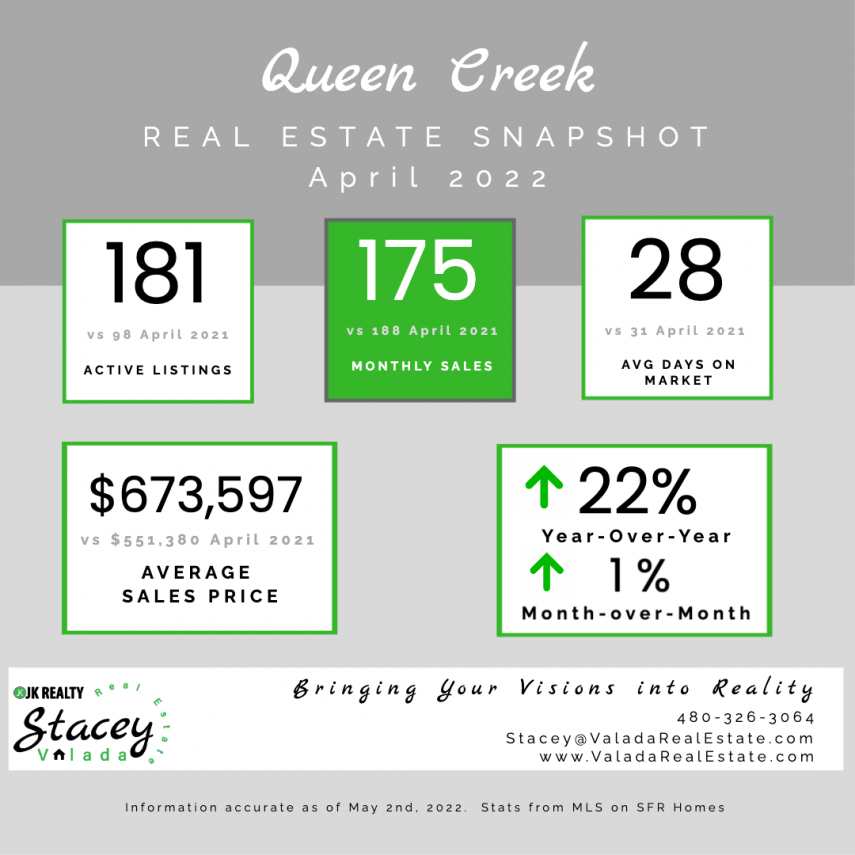
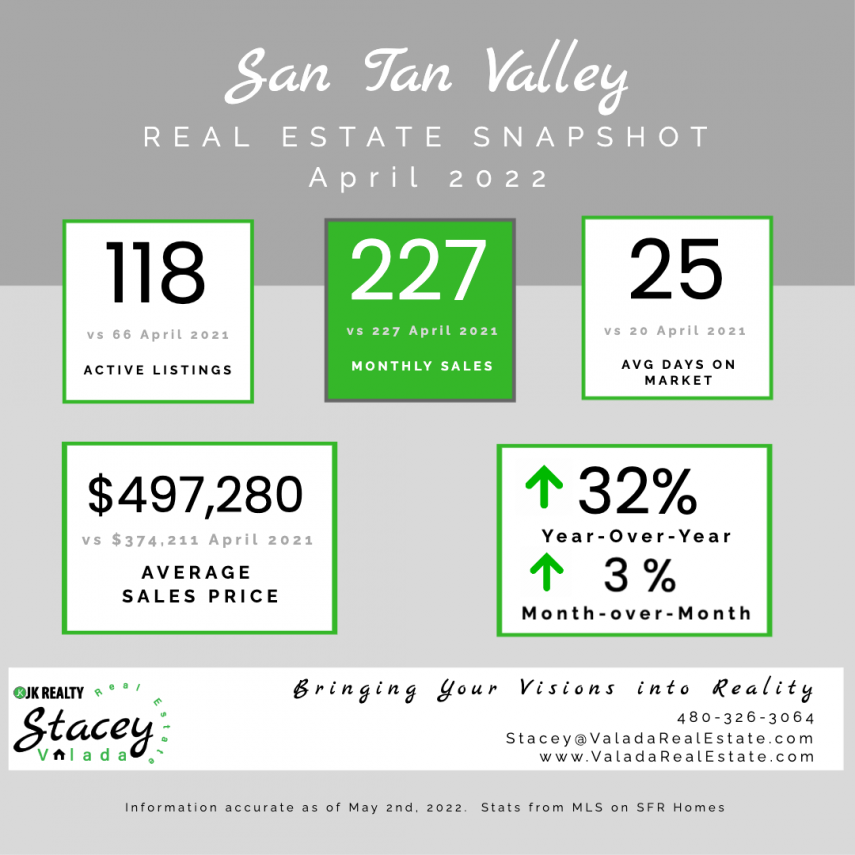
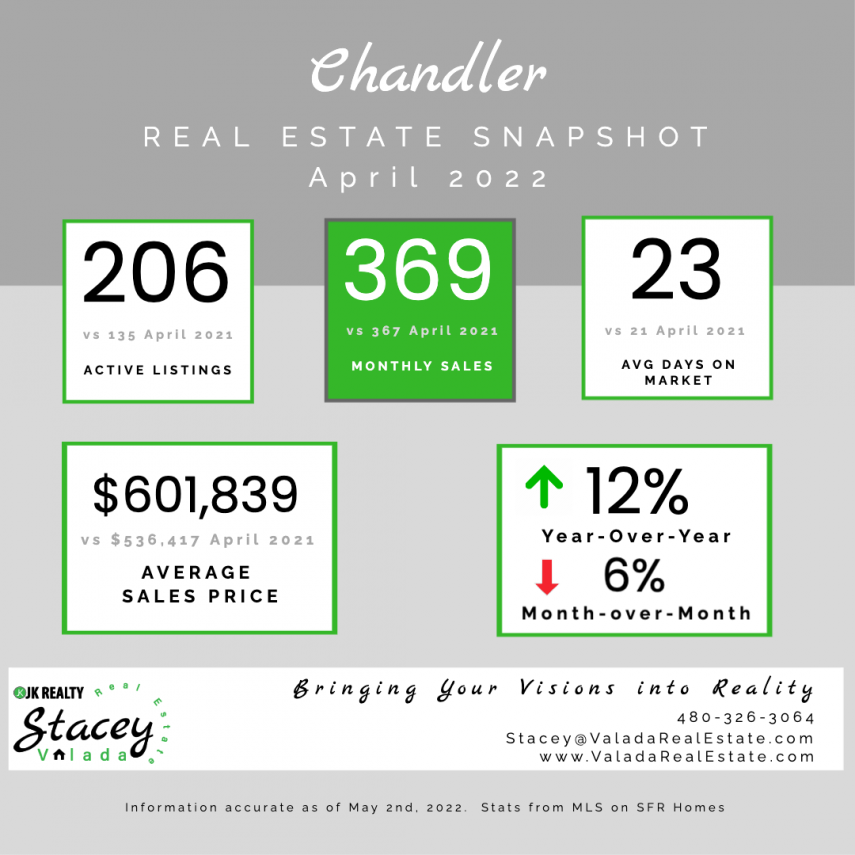
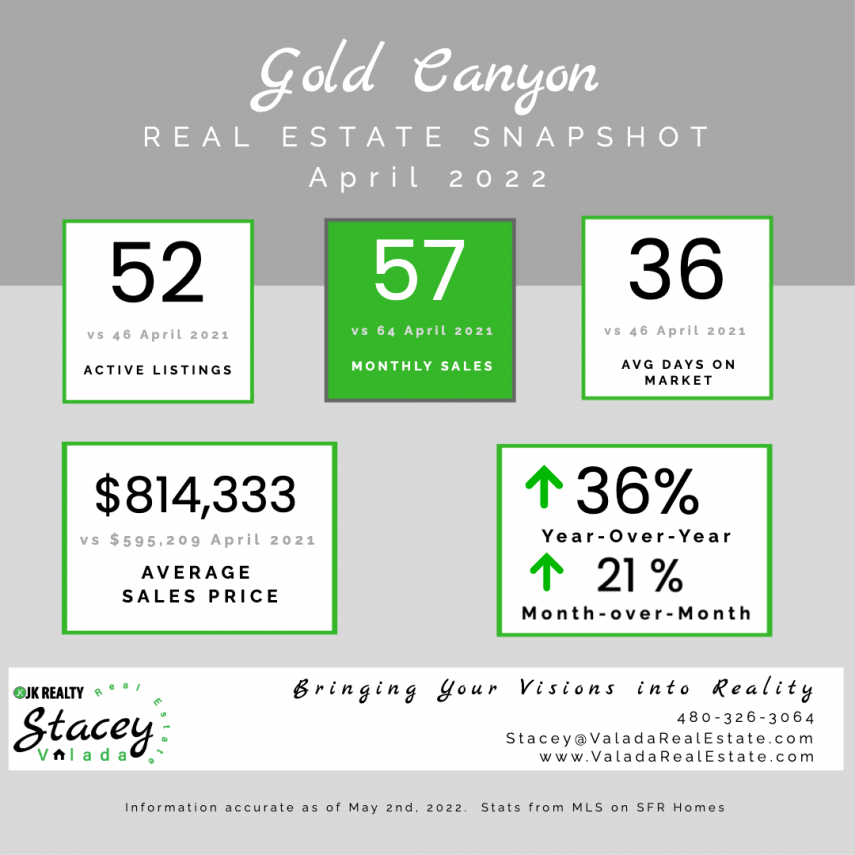
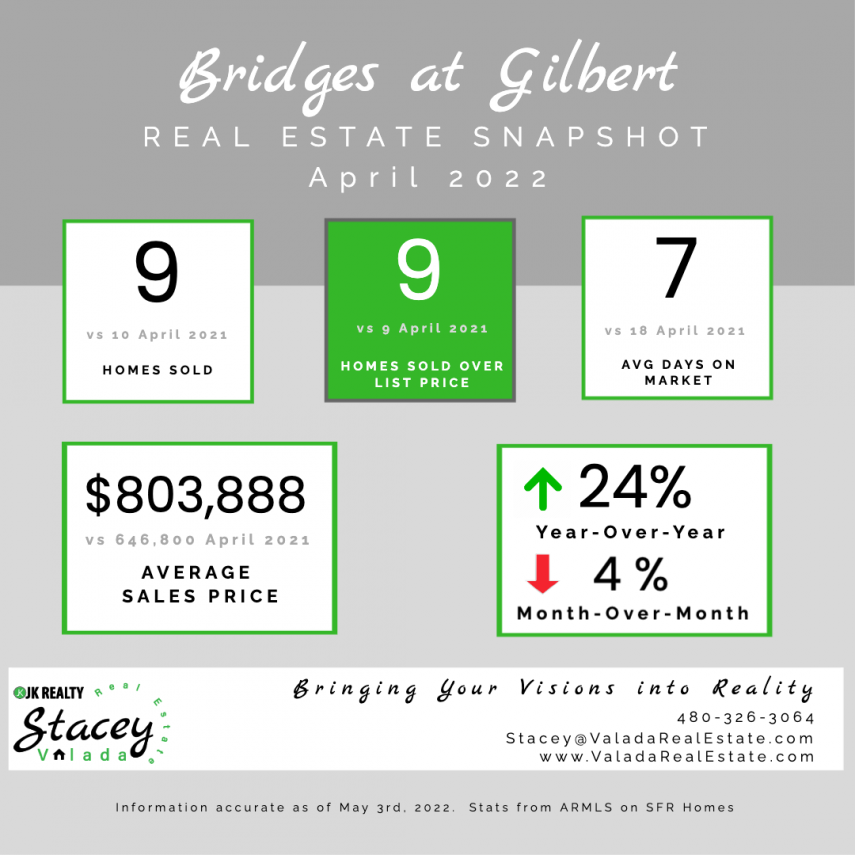
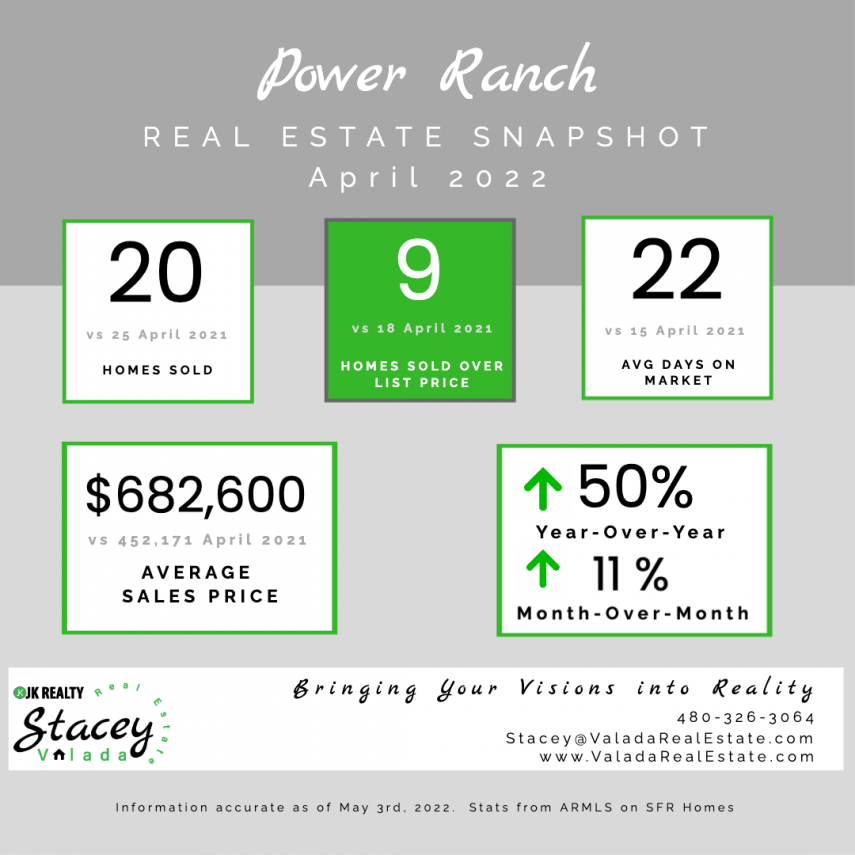
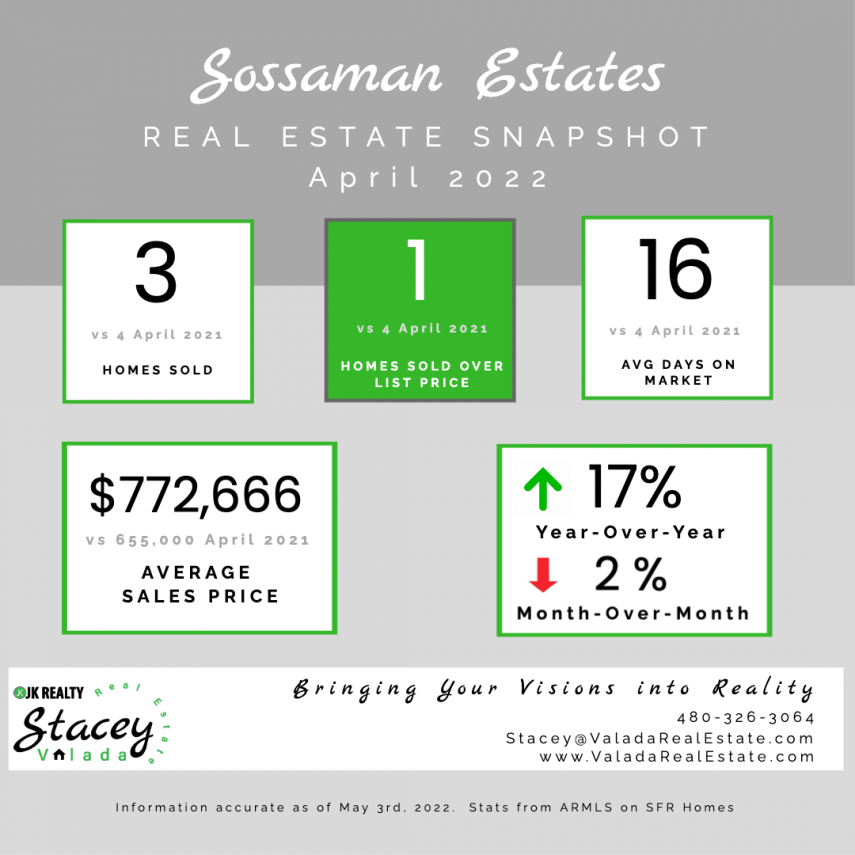
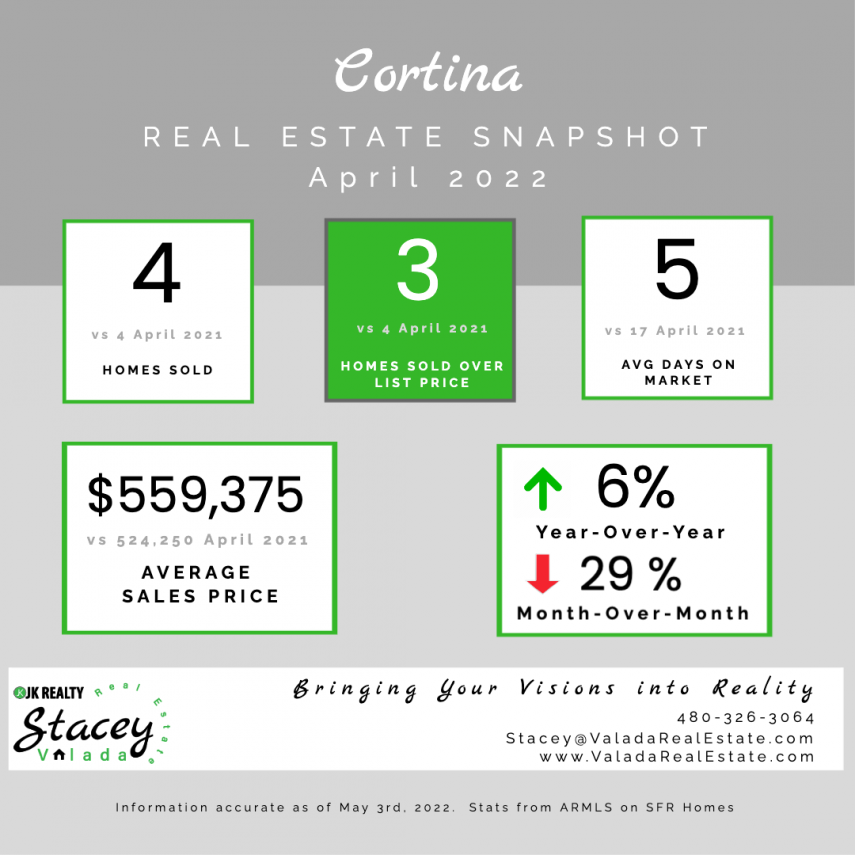
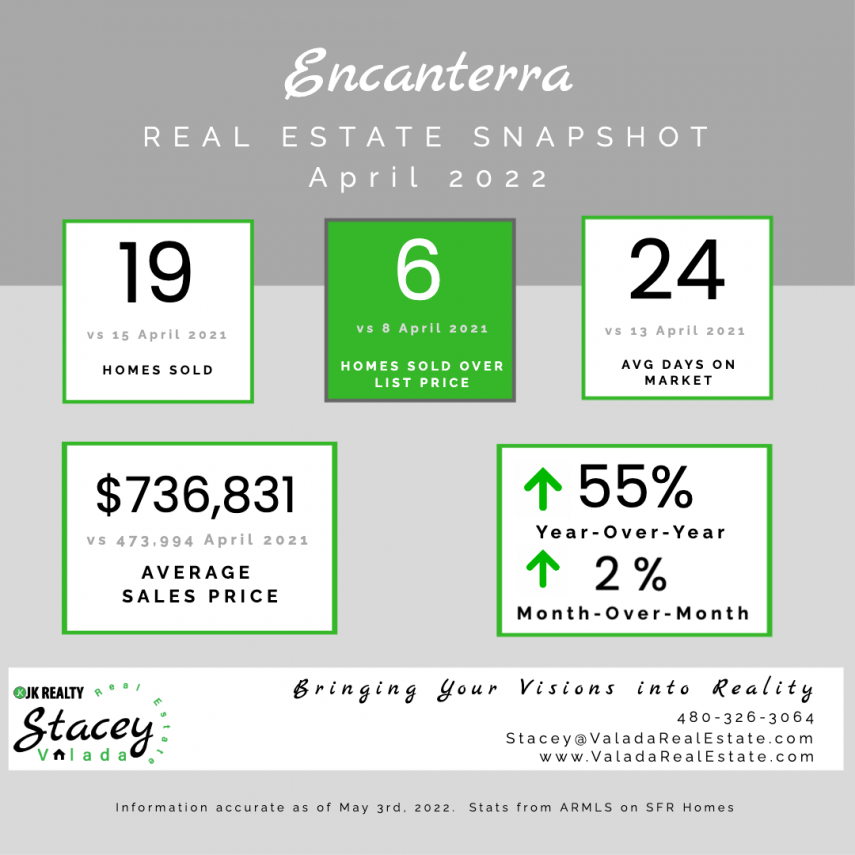
If you look at some of the specific SE Valley areas and neighborhoods, you will notice all still showed a year-over-year increase and most had a month-over-month increase as well.
Per your request, I will now add month-over-month statistics into these monthly snapshots. I do caution putting too much emphasis on one month or one city/neighborhood with a month-over-month decrease. Most neighborhoods have quite the range of size and level of homes, so if the smaller homes sold one month vs the previous month which had a lot of larger or higher-end homes, that will drastically tweak the numbers.
It is more important to watch trends over time, not just focus on one particular month or one particular neighborhood.

Leave a Reply